Saving Measurements
You can save sensor measurements to a file using the Isaac’s Apple observer application.
There are two different methods for saving measurements to a file.
- Save Measurements versus Time
This method is used when you want to save sensor measurements on the y axis of your graph (dependent variable) versus time on the x axis of your graph (independent variable). This method is useful for dynamic experiments involving accelerometers and gyroscopes
- Save Measurements versus your Variable.
This method is used when you want to save sensor measurements on the y axis of your graph versus some value you will measure and input for your independent variable on the x axis of your graph. This method is useful for experiments involving magnetometers and light sensors.
Save Measurements v. Time
If your experiment involves time as the independent variable, tap ‘Save Measurements vs. Time‘ to start and stop recording measurements to a file.
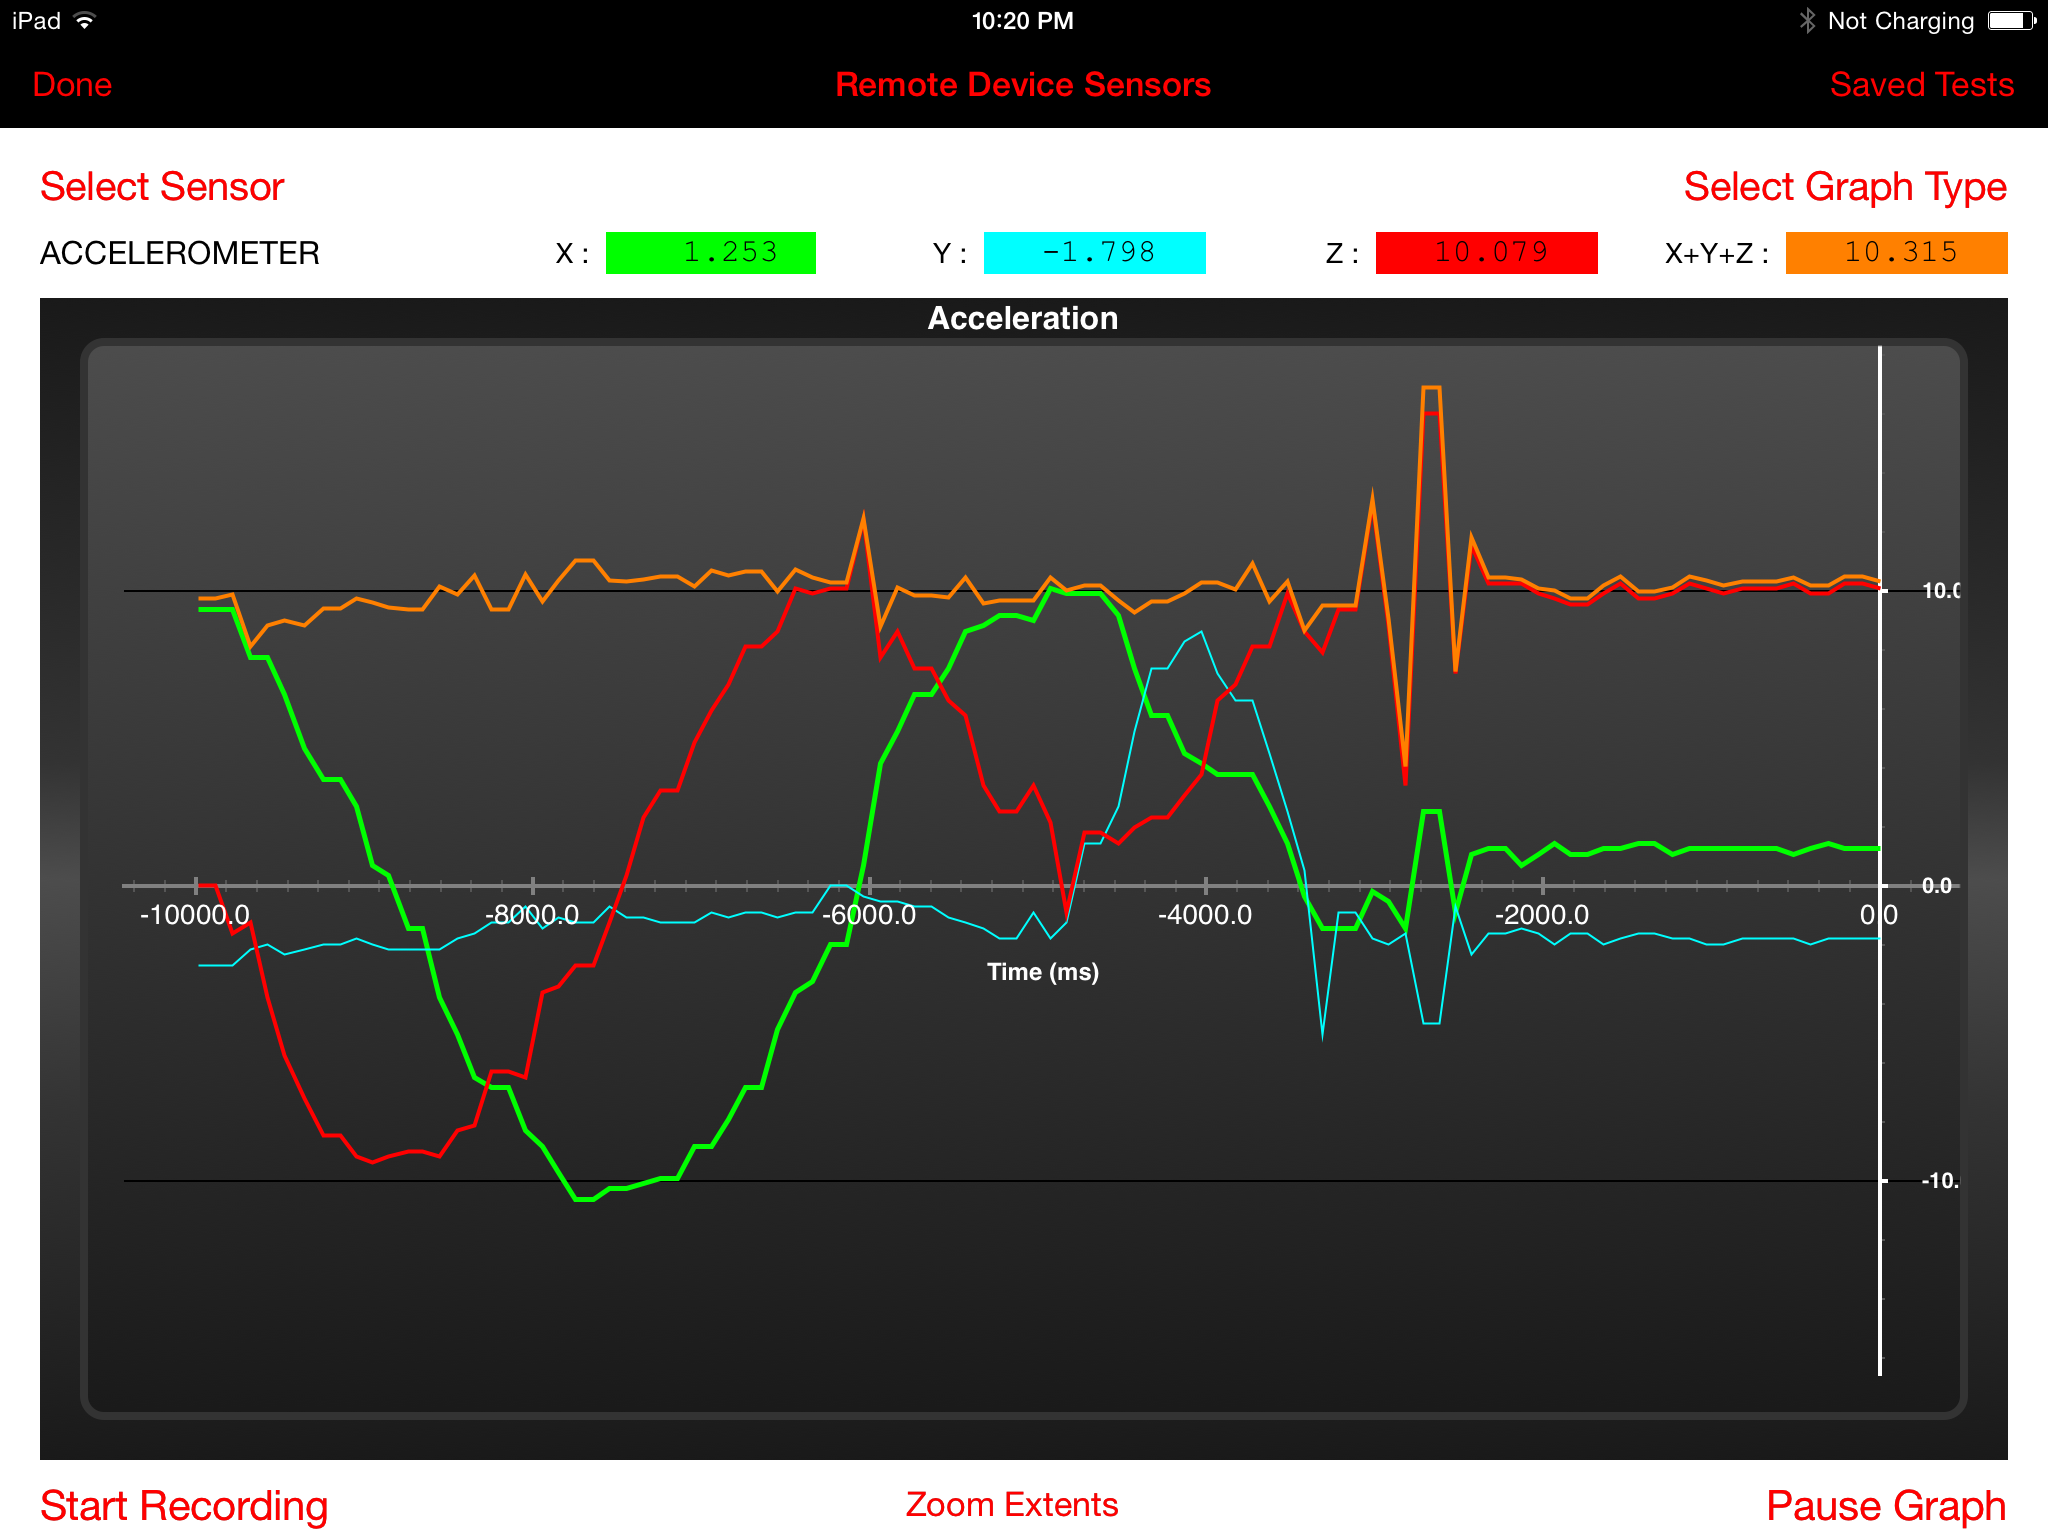
To begin saving sensor measurements to a file, tap ‘Start Recording‘. To end the experiment, tap ‘Stop Recording’. You can specify a name for the file, or you can discard the data and start over.
Tap ‘Pause Graph‘ to halt the graph updates if you want to have a look at the measurements that have just happened. When the graph is paused, you can choose to save the visible data (last 10 seconds of measurements) to a file by tapping ‘Save Data‘.
Files are saved to the program’s file storage on the iPad. If you are logged in, this file will also be saved to your shared file collection online.
Save Measurements v. Your Variable
If your experiment involves a value you will measure for the independent variable, you can save a file with sensor measurements versus a value you input for the x axis. To start a new experiment, or to continue an experiment, tap ‘Save Measurements vs. Value‘.
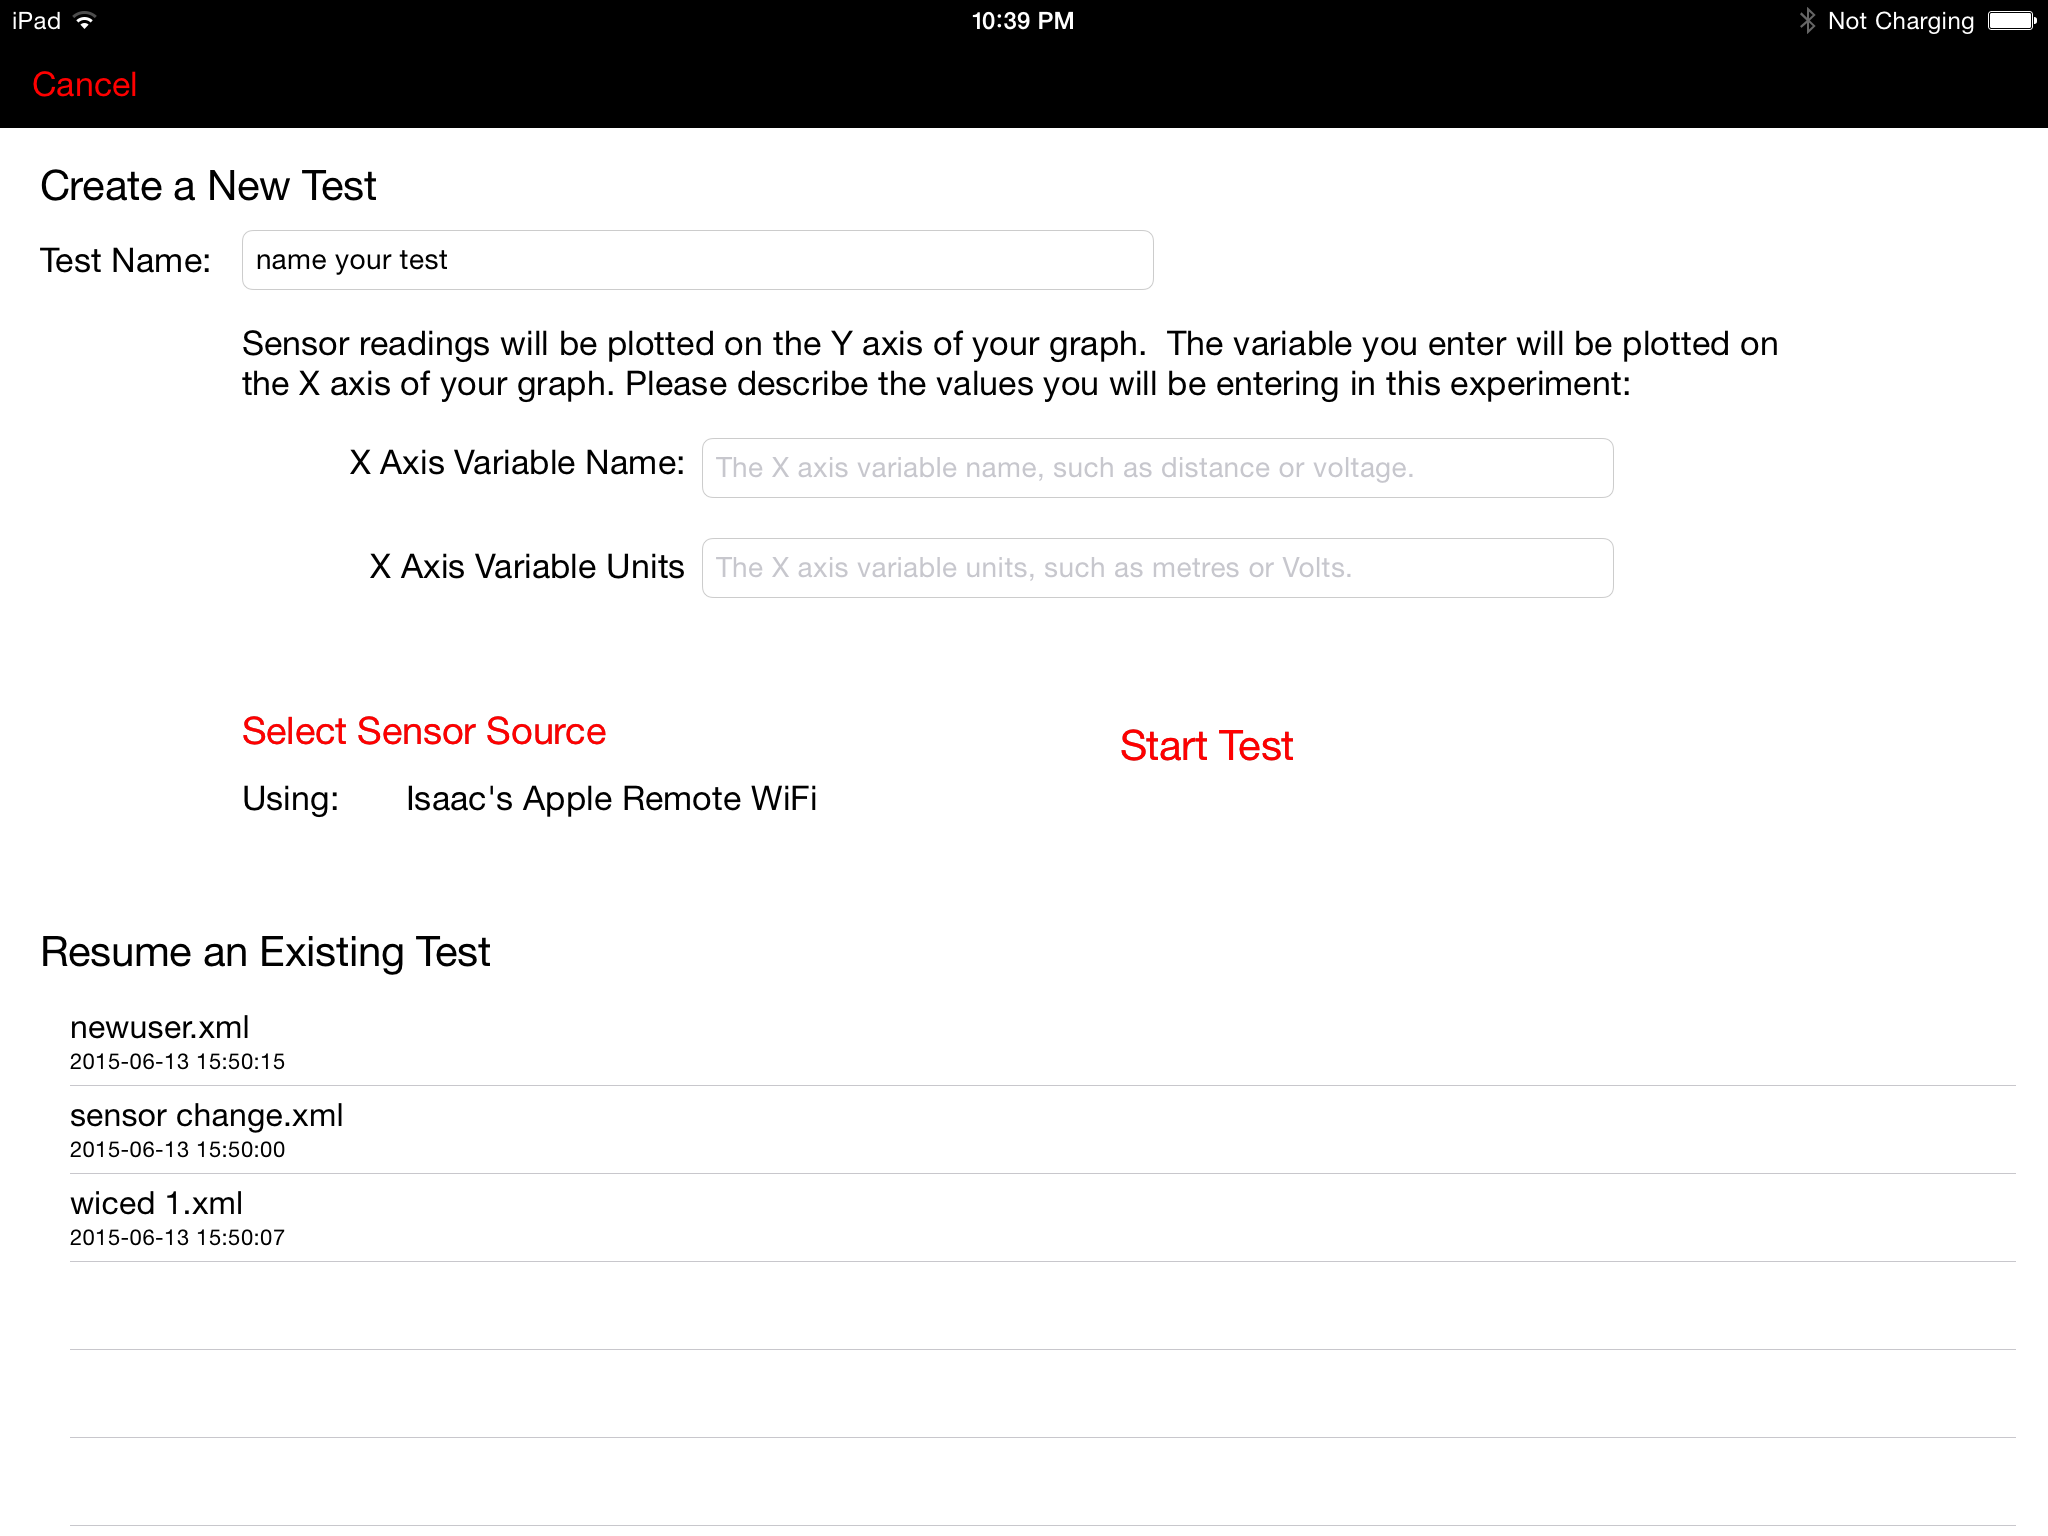
To begin a new test, enter a name for this test. You can enter the name of the quantity you will be measuring for the x axis as well as its units. Tap ‘Start Test‘ to begin measuring. To resume a previous experiment and add more data to the file, select an existing test from the list.
Once the experiment file is opened, you can see the current sensor measurement values on the top graph, and the measurements taken at each of your observation points on the bottom graph.
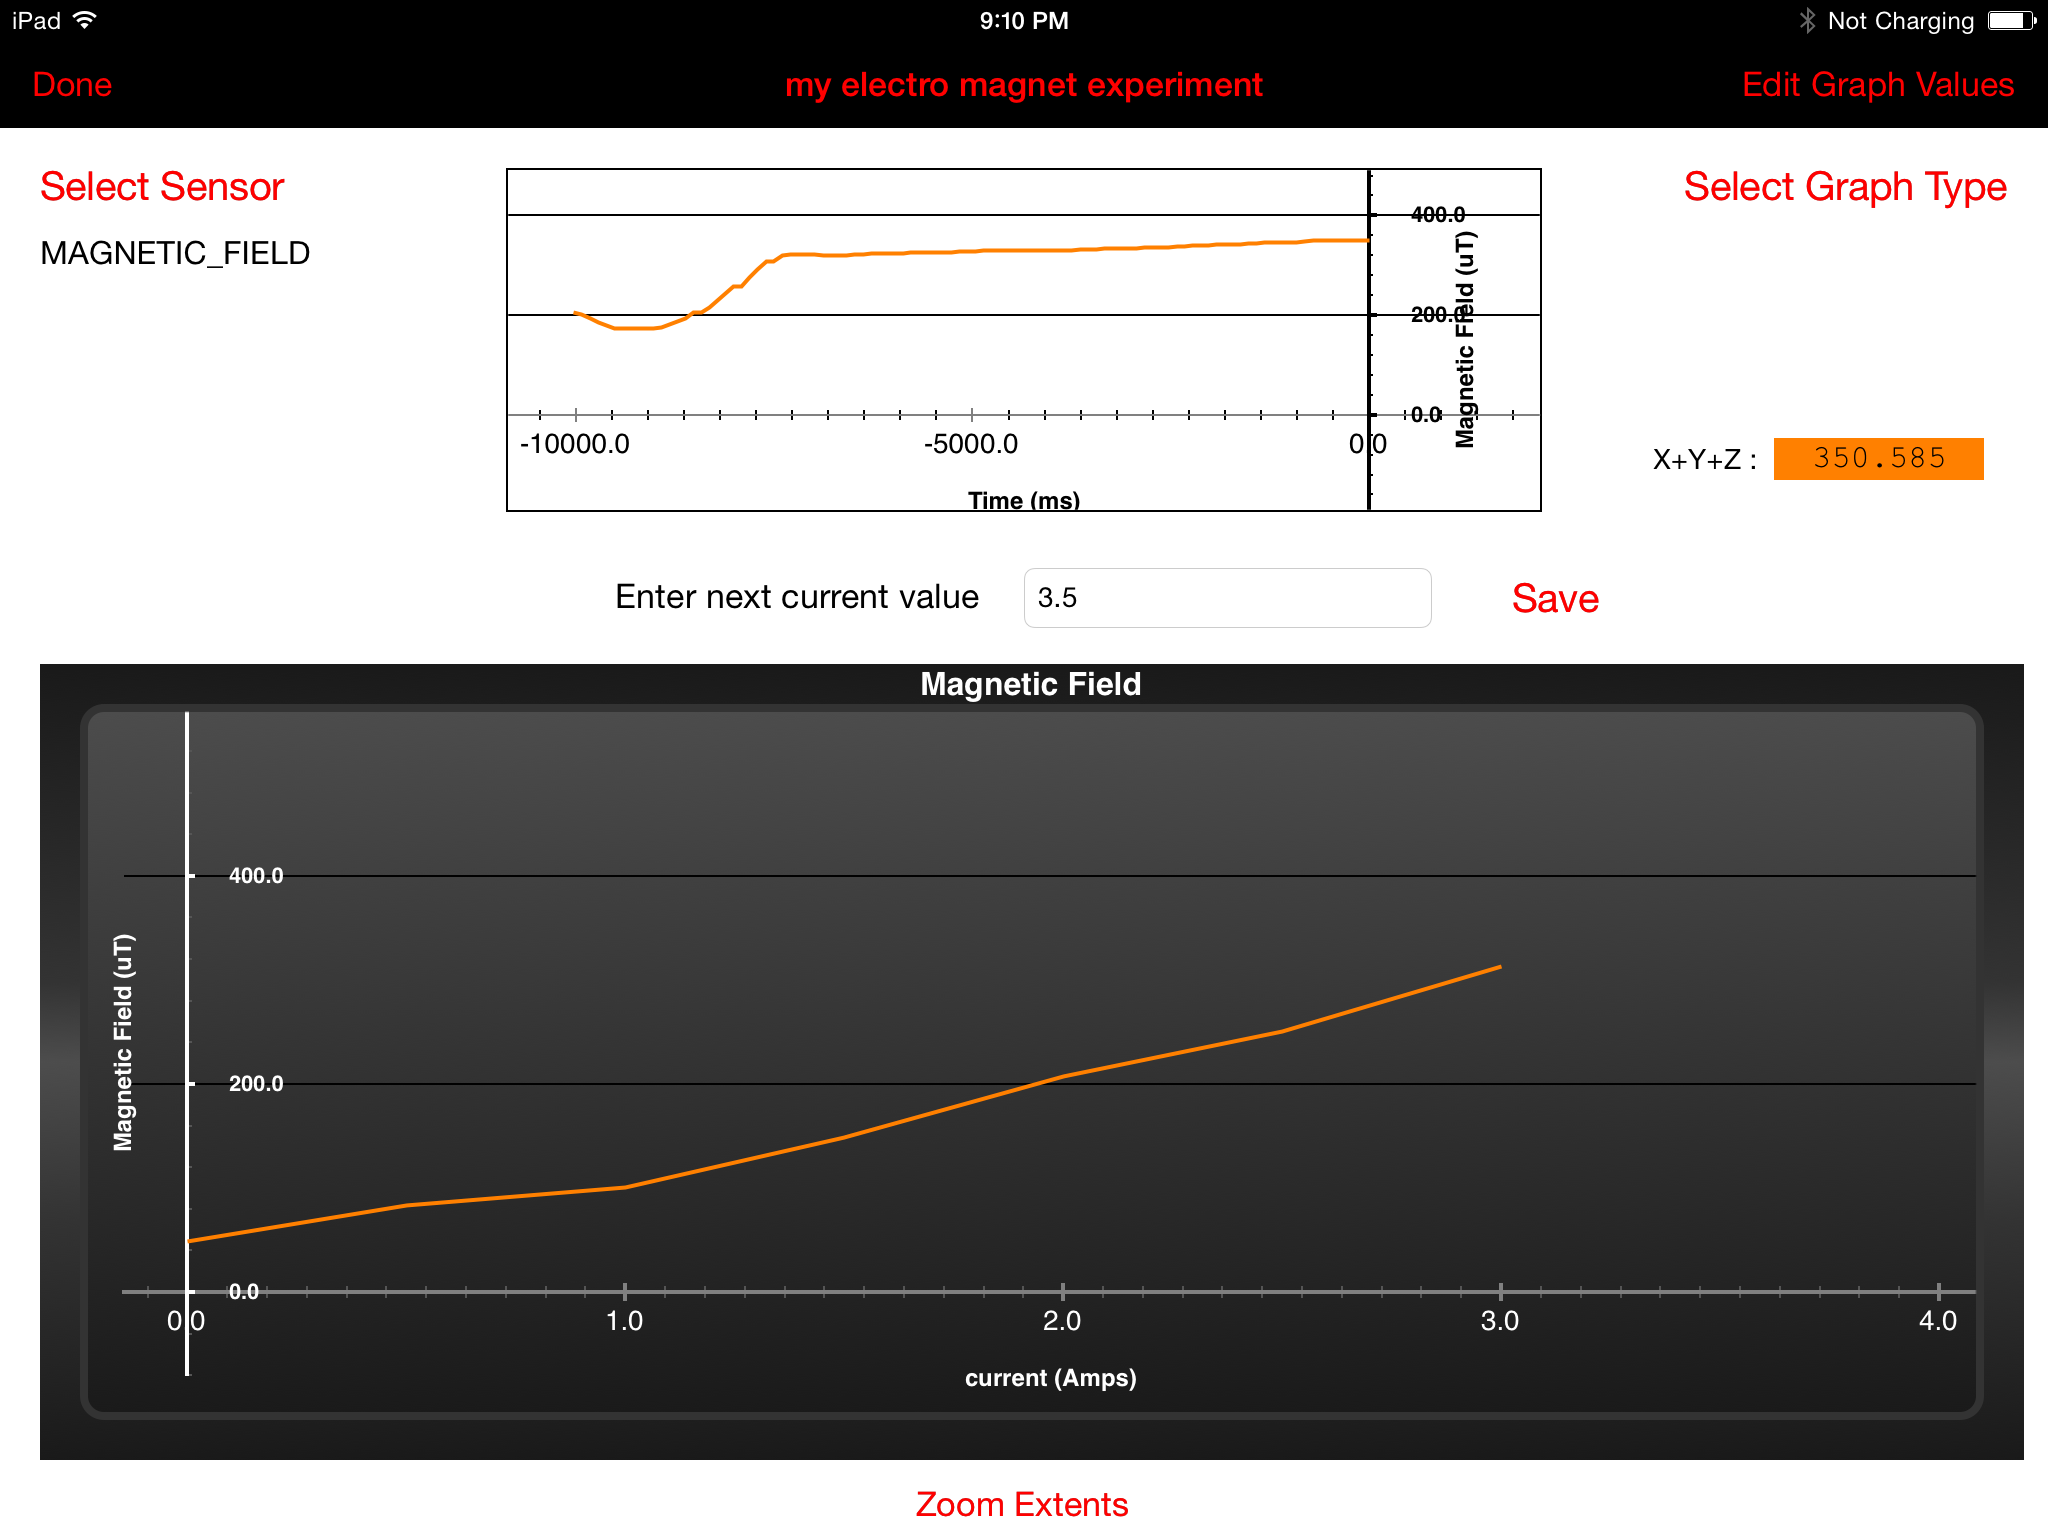
Enter the next value for your x axis measurement and tap ‘Save‘ to update the graph with the latest observation. Tap ‘Done‘ when you are finished and your file will be saved. If you are logged in, this file will automatically be synchronized to your shared files online.
If you make a mistake entering the value, you can tap ‘Edit Graph Values’ to modify any of the x axis values you have input.
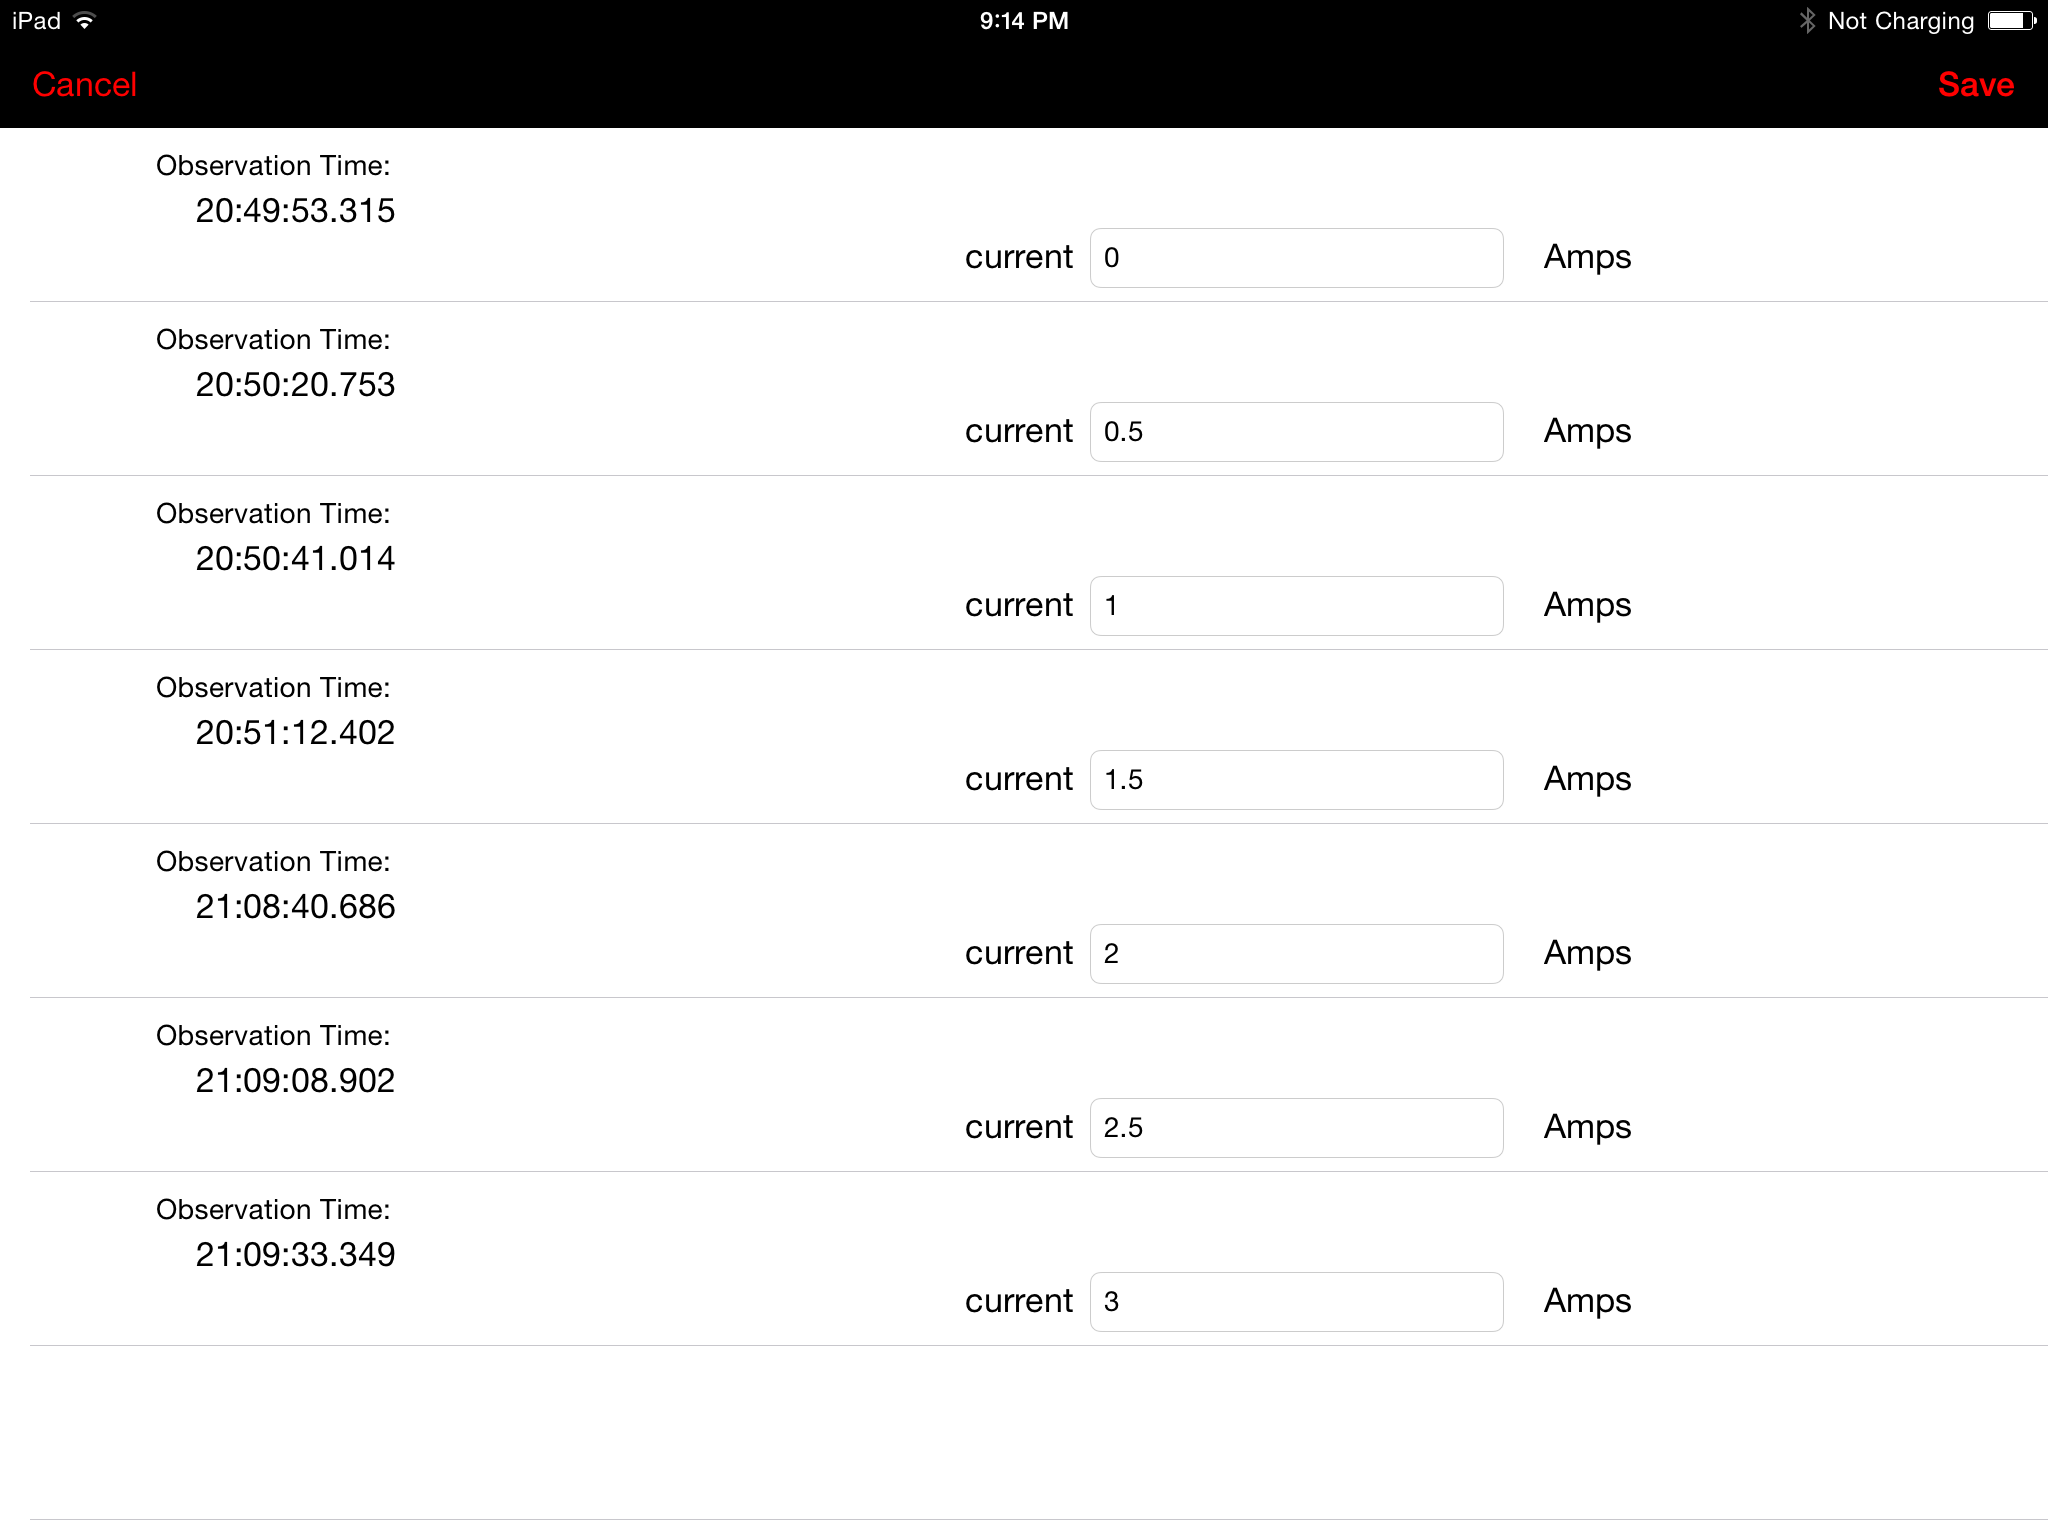
Modify input values and tap ‘Save’ to update the file.